

T&D Lab
Display Graphs and an Estimated WBGT from TR43A Measurements Using M5Stack Basic
Published : September 07, 2026
1. Introduction
The TR43A is a temperature and humidity data logger that measures and records environmental conditions, supports Bluetooth Low Energy (BLE) communication and allows users to check measurements on the device LCD, from a mobile device, and through T&D cloud services.
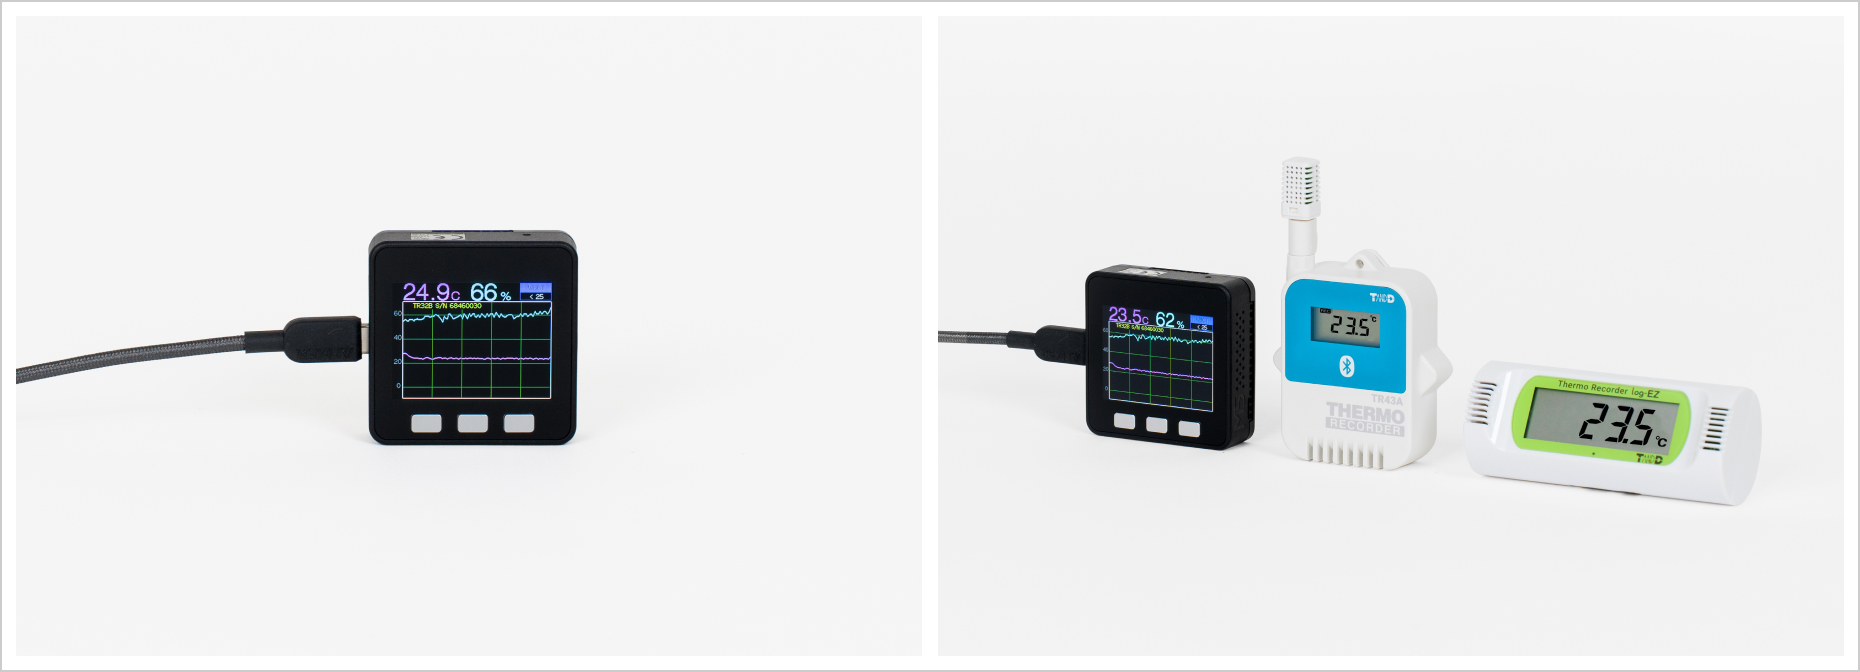
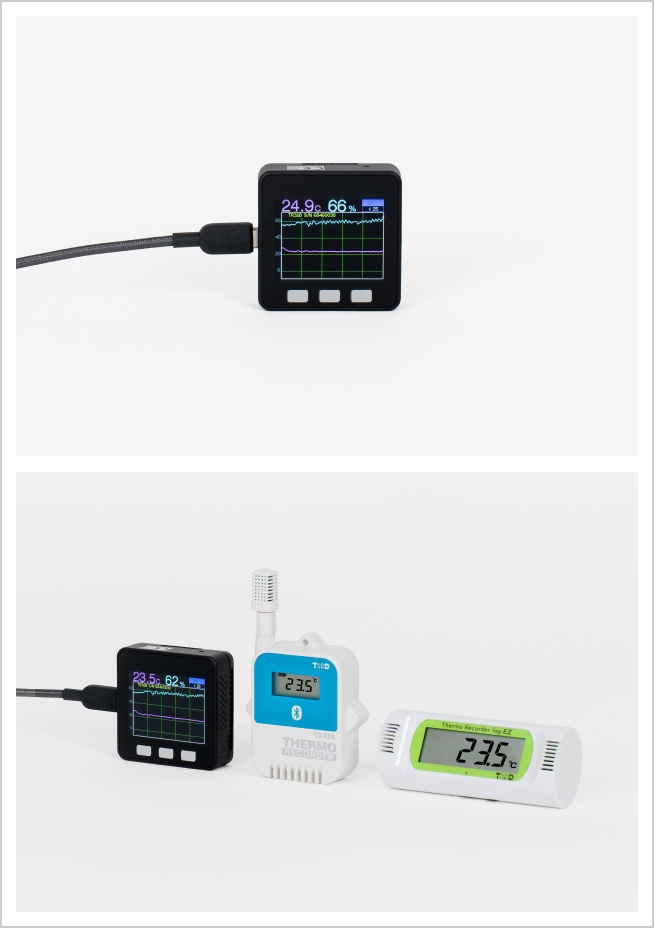
In this article, an M5Stack Basic microcontroller module receives BLE advertising packets transmitted by a TR43A and displays measurement data on its color LCD. In addition to displaying temperature and humidity values, the system can present historical trends in graph form and display an estimated WBGT (Wet Bulb Globe Temperature) value that can be used as a general heat-stress indicator.
The WBGT value shown in this example is a simplified estimate calculated from temperature and humidity measurements for indoor environments without direct sunlight.
The same approach can also be applied to the TR32B (log-EZ) .
2. System Overview
2-1. Bluetooth Low Energy Communication
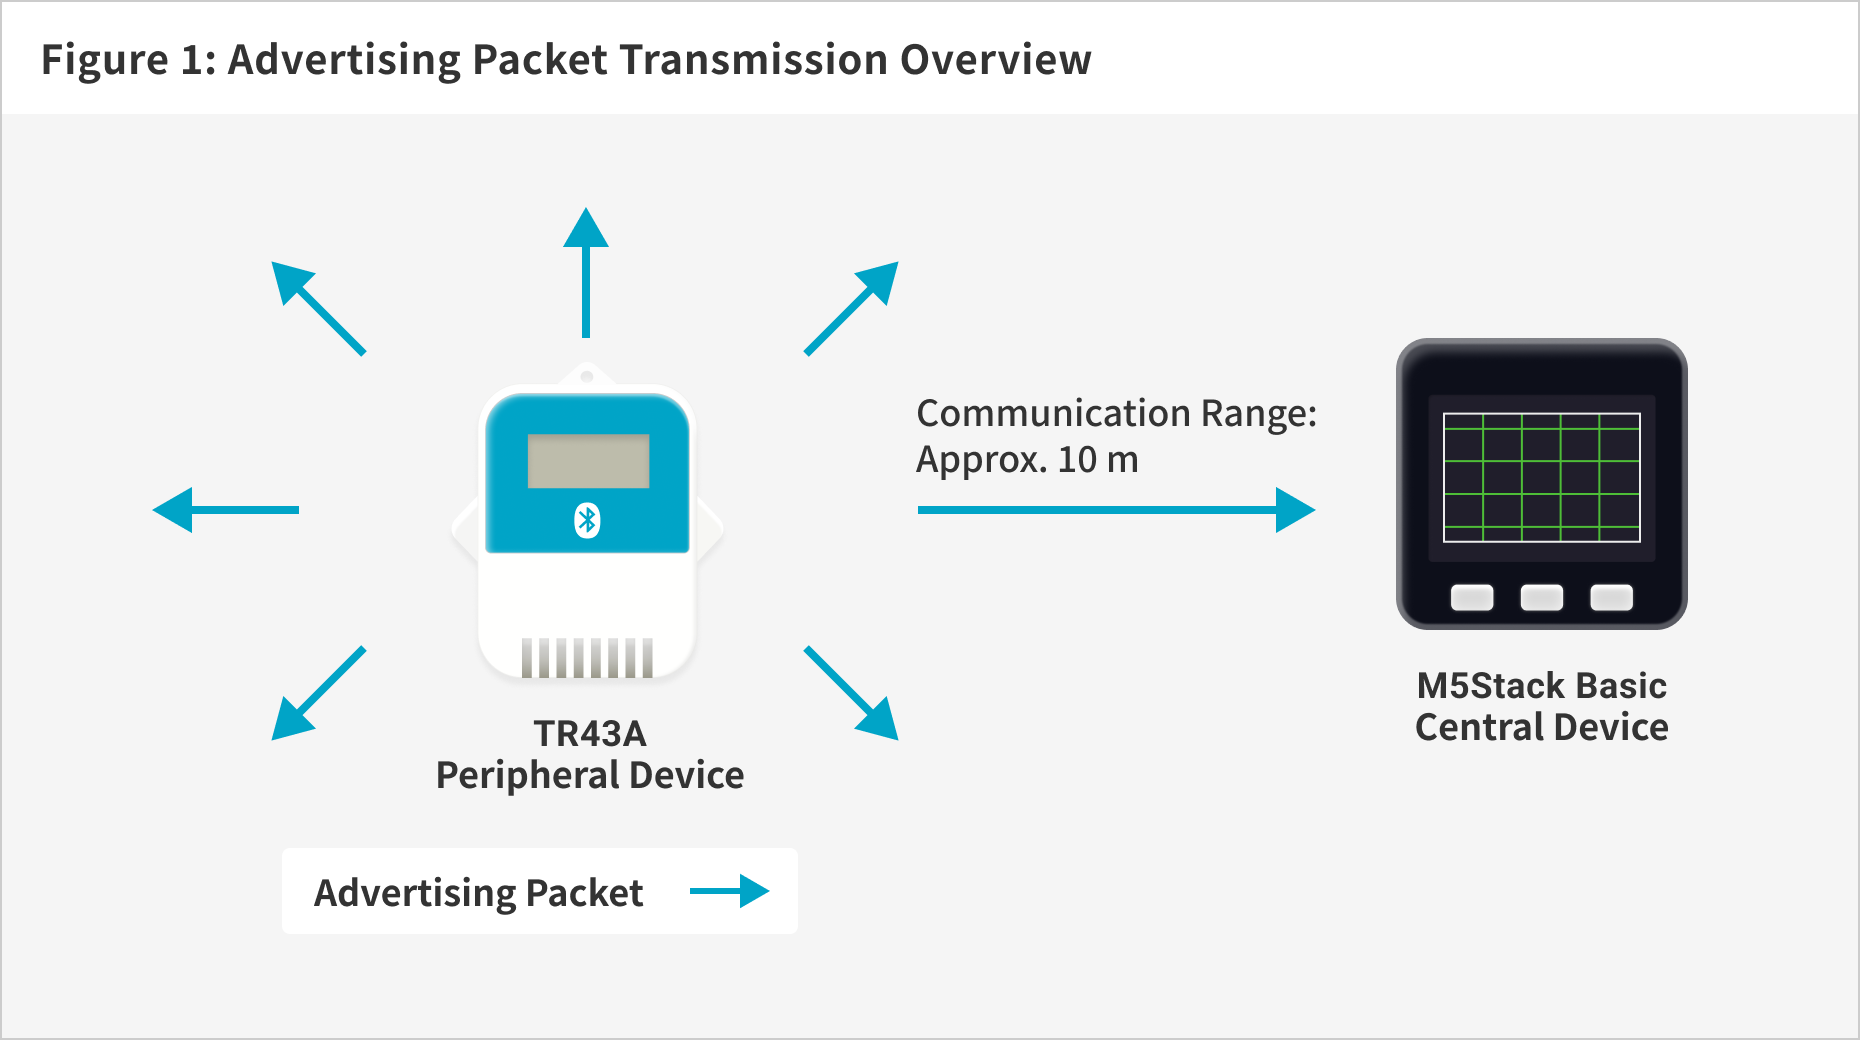
In BLE communication, sensor devices such as the TR43A operate as peripheral devices. Devices that obtain data from peripherals operate as central devices. Smartphones are a common example of central devices. In this project, the M5Stack functions as the central device.
As illustrated in Figure 1, BLE peripherals periodically broadcast advertising packets containing device information. The advertising packets transmitted by the TR43A include temperature and humidity measurements. The M5Stack receives these packets and extracts the measurement values for display.
2-2. About WBGT
WBGT stands for Wet Bulb Globe Temperature. It is a heat-stress index used as a guideline for preventing heat-related illness.
The WBGT value used in this project is not a direct WBGT measurement. It is a simplified estimate calculated from temperature and humidity measurements for indoor environments without direct sunlight.
The estimation method is based on the Indoor WBGT Simple Estimation Chart Ver.4 (in Japanese only) from the Guidelines for Heatstroke Prevention in Daily Life Ver.4, published by the Japanese Society of Biometeorology.
The color coding displayed on the M5Stack LCD is based on the Heat Stress Index (WBGT) classification used by Japan’s Ministry of the Environment on its Heat Illness Prevention Information website.
Table 1.
| WBGT (Heat Stress Index) | Risk Category | Value Defined in the Script (Return Value of the WBGT() Function) |
|---|---|---|
| Below 25 | Caution | 0 |
| 25 to less than 28 | Warning | 1 |
| 28 to less than 31 | Severe Warning | 2 |
| 31 and above | Danger | 3 |
Important Notes
• The estimated WBGT is intended only for indoor environments without direct sunlight.
• It must not be used outdoors or indoors with direct sunlight or radiant heat sources.
• The classifications shown above are intended for daily life and are not occupational heat-stress standards.
• For outdoor use or indoor environments with radiant heat, use a WBGT meter equipped with a black globe thermometer.
2-3. Graph Display
The graph can display measurements from one selected TR43A at a time.
Temperature and humidity are displayed as line graphs using the same scale. The maximum value shown on the vertical axis is 70. Values above this limit are displayed at the top edge of the graph.
The left side of the graph displays vertical-axis labels of 0, 20, 40, and 60. Temperature values are expressed in degrees Celsius and humidity values in percent.
The horizontal axis represents time. Each grid interval corresponds to one hour. Up to five hours of historical data can be displayed.
The graph updates once every minute.
3. What You'll Need
3-1. TR43A Data Logger
The TR43A records temperature and humidity data and communicates using Bluetooth Low Energy.
3-2. M5Stack Basic
The M5Stack Basic is a compact microcontroller module that includes a CPU, Bluetooth functionality, a 2-inch color LCD, and wireless networking capabilities.
For detailed specifications, refer to the official M5Stack documentation:
https://docs.m5stack.com/en/core/basic_v2.7
3-3. Arduino IDE
Programs for the M5Stack Basic are created using Arduino IDE.
In Arduino IDE, a program is called a sketch, so the term sketch will be used throughout this article.
Arduino IDE is an Integrated Development Environment (IDE) that includes a code editor, tools for uploading sketches to the M5Stack Basic, and a Serial Monitor for debugging and communication.
For information on installing Arduino IDE and setting up the M5Stack development environment, refer to the official M5Stack documentation:
https://docs.m5stack.com/en/start
Development Environment Used for This Project:
Arduino IDE Version: 2.3.10
Board Manager: M5Stack by M5Stack official (Version 3.3.7)
Board: [Tools] → [Board] → [M5Core]
OS: Windows 11 Home
4. Understanding the Sketch
4-1. Overview
When starting a new sketch, select File > New Sketch from the Arduino IDE menu. This creates a new sketch containing empty setup() and loop() functions, where you can begin writing your code.
The setup() function runs only once when the M5Stack is powered on, while the loop() function runs repeatedly after setup() has finished.
In addition to setup() and loop(), this sketch also includes several custom functions.
Entering the entire sketch manually can be time-consuming, so we recommend copying and pasting the sample code provided later in Listing 1 and using it as a starting point.
In Arduino sketches, any text following // on a line is treated as a comment and is not executed as part of the program.
4-2. Overview
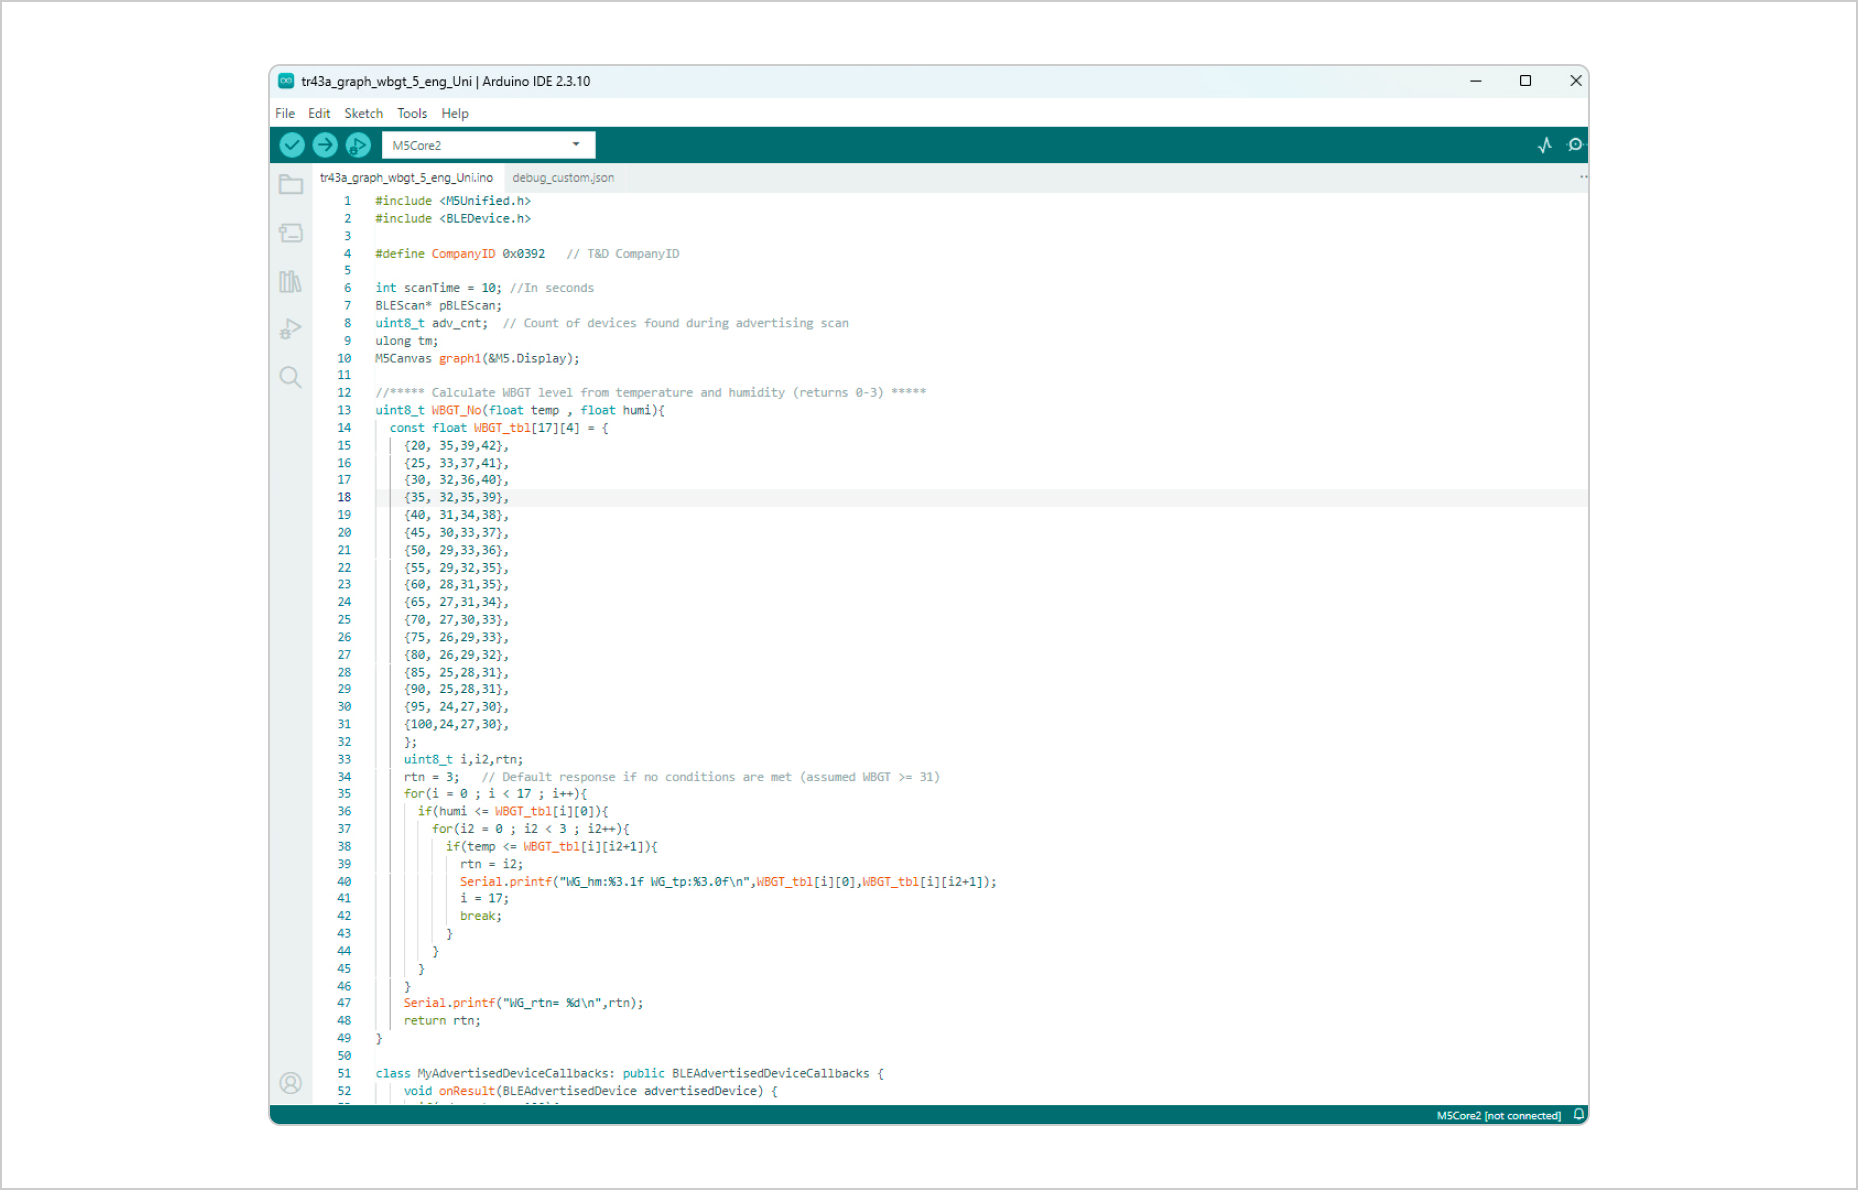
The complete sketch created for this project is shown in Listing 1 below.
Download the Sketch
Listing 1
ーーーーーーーーーーーーーーーーーーーーーーーーーーーーーーーーーーーーー #include#include #define CompanyID 0x0392 // T&D CompanyID int scanTime = 10; //In seconds BLEScan* pBLEScan; uint8_t adv_cnt; // Count of devices found during advertising scan ulong tm; M5Canvas graph1(&M5.Display); //***** Calculate WBGT level from temperature and humidity (returns 0-3) ***** uint8_t WBGT_No(float temp , float humi){ const float WBGT_tbl[17][4] = { {20, 35,39,42}, {25, 33,37,41}, {30, 32,36,40}, {35, 32,35,39}, {40, 31,34,38}, {45, 30,33,37}, {50, 29,33,36}, {55, 29,32,35}, {60, 28,31,35}, {65, 27,31,34}, {70, 27,30,33}, {75, 26,29,33}, {80, 26,29,32}, {85, 25,28,31}, {90, 25,28,31}, {95, 24,27,30}, {100,24,27,30}, }; uint8_t i,i2,rtn; rtn = 3; // Default response if no conditions are met (assumed WBGT >= 31) for(i = 0 ; i < 17 ; i++){ if(humi <= WBGT_tbl[i][0]){ for(i2 = 0 ; i2 < 3 ; i2++){ if(temp <= WBGT_tbl[i][i2+1]){ rtn = i2; Serial.printf("WG_hm:%3.1f WG_tp:%3.0f\n",WBGT_tbl[i][0],WBGT_tbl[i][i2+1]); i = 17; break; } } } } Serial.printf("WG_rtn= %d\n",rtn); return rtn; } class MyAdvertisedDeviceCallbacks: public BLEAdvertisedDeviceCallbacks { void onResult(BLEAdvertisedDevice advertisedDevice) { if(adv_cnt++ > 100){ pBLEScan->stop(); } //Serial.printf("Advertised Device: %s \n", advertisedDevice.toString().c_str()); } }; void setup() { auto cfg = M5.config(); M5.begin(cfg); Serial.begin(115200); // Initialize serial communication Serial.println("Scanning..."); graph1.setColorDepth(8); // Set graph color depth to 8-bit (256 colors) graph1.createSprite(300, 198); // Set graph area size to 300x198 dots M5.Display.drawString("Scanning...",0,0,4); BLEDevice::init(""); // Initialize BLE pBLEScan = BLEDevice::getScan(); // Get BLE scan object pBLEScan->setActiveScan(false); // Passive scan pBLEScan->setAdvertisedDeviceCallbacks(new MyAdvertisedDeviceCallbacks()); pBLEScan->setInterval(3200); pBLEScan->setWindow(3200); } void loop() { uint8_t i; static uint8_t mode = 0,count,TargetCnt = 0,TargetNo; static BLEScanResults* foundDevices = nullptr; static BLEAdvertisedDevice d; static uint32_t siri[8]; // Serial numbers of TR43A found during advertising scan static uint16_t Xpos = 0,Xpos_bf = 0,tp_y_bf = 0,hm_y_bf = 0; // Variables for graph plot positions Serial.printf("mode= %d\n",mode); switch(mode){ case 0: if(tm == 0)tm = millis() + 60000; // Set next graph update time to 60 seconds later adv_cnt = 0; foundDevices = pBLEScan->start(scanTime); // Start advertising scan count = foundDevices->getCount(); // count = number of devices found //Serial.printf("count= %d\n",count); if(TargetCnt != 0)mode = 2; // If target device is determined, go to graph display (mode=2) else mode = 1; // If not determined, go to device selection screen (mode=1) break; case 1: for(i = 0 ; i < count ; i++){ // Iterate through all found devices d = foundDevices->getDevice(i); if(d.haveManufacturerData()){ //### Execute if advertising packet contains ManufacturerData ### String data = d.getManufacturerData(); // data = received ManufacturerData int manu = data[1] << 8 | data[0]; // manu = received Company ID if((manu == CompanyID)&&((data[4] >= 0x44)&&(data[4] <= 0x47))){ //### Execute if ManufacturerData matches TR43A/TR32B ### siri[TargetCnt] = ((uint32_t)data[5]<<24)+ ((uint32_t)data[4]<<16)+((uint32_t)data[3]<<8)+data[2]; M5.Display.drawString("------ Select Device ------",0,1,4); // Title for device selection screen M5.Display.setCursor(25,(TargetCnt+1)*26,4); if((data[4] == 0x44)||(data[4] == 0x45)) M5.Display.print("TR43A"); // Model is TR43A else if((data[4] == 0x46)||(data[4] == 0x47))M5.Display.print("TR32B"); // Model is TR32B M5.Display.printf(" S/N %08X",siri[TargetCnt]); // Display serial number if(TargetCnt < 7)TargetCnt++; } } } if(TargetCnt == 0)mode=0; // If no devices found, scan again tm = millis() + 10000; // Set timeout to transition to graph display to 10 seconds later TargetNo = 1; M5.Display.drawString(">",1,26,4); // Initial display of device selection cursor M5.Display.fillRect(40, 230, 50, 10, RED); // Red mark indicating switch position while(mode==1){ M5.update(); if(M5.BtnA.wasPressed()){ // Check if M5Stack Button A (left) was pressed TargetNo = TargetNo + 1; if(TargetCnt < TargetNo)TargetNo = 1; for(i = 1 ; i < 8 ; i++){ if(i == TargetNo)M5.Display.drawString(">",1,TargetNo*26,4); // Show cursor on selected row else M5.Display.fillRect(0,i*26,20,26,BLACK); // Erase cursor on unselected rows } tm = millis() + 5000; } if(millis() > tm){ // Check if switch wait time has expired M5.Display.fillScreen(BLACK); // Clear screen (fill with black) mode = 2; } } break; case 2: if(Xpos < 299){ Xpos++; } else { graph1.scroll(-1, 0); Xpos = 299; Xpos_bf--; } for(i = 0 ; i < count ; i++){ // Iterate through all found devices d = foundDevices->getDevice(i); if(d.haveManufacturerData()){ //### Execute if advertising packet contains ManufacturerData ### String data = d.getManufacturerData(); // data = received ManufacturerData int manu = data[1] << 8 | data[0]; // manu = received Company ID if((manu == CompanyID)&&((data[4] >= 0x44)&&(data[4] <= 0x47))){ //### Execute if ManufacturerData matches TR32B/TR43A ### uint32_t siri_tmp = ((uint32_t)data[5]<<24)+ ((uint32_t)data[4]<<16)+((uint32_t)data[3]<<8)+data[2]; if(siri[TargetNo-1] == siri_tmp){ float temp = data[11] << 8 | data[10]; // Get temperature from ManufacturerData temp = (temp - 1000) / 10; // Convert temperature data to XX.X [degC] float humi = data[13] << 8 | data[12]; // Get humidity from ManufacturerData humi = (humi - 1000) / 10; // Convert humidity data to XX.X [%] Serial.printf("Xpos_bf = %d tp_y_bf = %d\n",Xpos_bf,tp_y_bf); uint16_t tp_cal = 0; if(temp < 70)tp_cal = 200-int((temp+10)*2.5); // Temperature -> Calculate Y-coordinate for graph uint16_t hm_cal = 0; if(humi < 70)hm_cal = 200-int((humi+10)*2.5); // Humidity -> Calculate Y-coordinate for graph if(tp_y_bf == 0){ // Plot only for the leftmost edge of the graph graph1.fillRect(Xpos, tp_cal,2,2,MAGENTA); // Dot for temperature graph graph1.fillRect(Xpos, hm_cal,2,2,CYAN); // Dot for humidity graph } else{ // Draw lines for other positions graph1.drawLine(Xpos_bf,tp_y_bf,Xpos,tp_cal,MAGENTA); // Line for temperature graph1.drawLine(Xpos_bf,hm_y_bf,Xpos,hm_cal,CYAN); // Line for humidity graph1.drawLine(Xpos_bf,tp_y_bf+1,Xpos,tp_cal+1,MAGENTA); // Line for temperature (bold) graph1.drawLine(Xpos_bf,hm_y_bf+1,Xpos,hm_cal+1,CYAN); // Line for humidity (bold) } Xpos_bf = Xpos; // Save current X-axis position tp_y_bf = tp_cal; // Save current temperature Y-axis position hm_y_bf = hm_cal; // Save current humidity Y-axis position graph1.pushSprite(18, 40); // Specify top-left coordinates for graph drawing (X, Y) Serial.printf("temp_tate = %d humi_tate = %d\n",tp_cal,hm_cal); M5.Display.drawRoundRect(17, 38, 302, 202, 2, WHITE); // Display white border for graph M5.Display.setTextColor(GREENYELLOW); // Set text color for serial number M5.Display.setCursor(38,39,2); // Set display position for serial number if((data[4] == 0x44)||(data[4] == 0x45)) M5.Display.print("TR43A"); // Model is TR43A else if((data[4] == 0x46)||(data[4] == 0x47))M5.Display.print("TR32B"); // Model is TR32B M5.Display.printf(" S/N %08X",siri[TargetNo-1]); // Display serial number M5.Display.setTextColor(DARKGREY); // Color for vertical axis values M5.Display.drawString("60",0,55,2); // Vertical axis label "60" M5.Display.drawString("40",0,105,2); // Vertical axis label "40" M5.Display.drawString("20",0,155,2); // Vertical axis label "20" M5.Display.drawString(" 0",0,205,2); // Vertical axis label "0" M5.Display.drawLine(18, 66, 317, 66, DARKGREEN); // Horizontal grid line [60] M5.Display.drawLine(18, 116, 317, 116, DARKGREEN); // Horizontal grid line [40] M5.Display.drawLine(18, 166, 317, 166, DARKGREEN); // Horizontal grid line [20] M5.Display.drawLine(18, 216, 317, 216, DARKGREEN); // Horizontal grid line [0] M5.Display.drawLine(77, 55, 77, 238, DARKGREEN); // Vertical grid line 1 M5.Display.drawLine(137, 55, 137, 238, DARKGREEN); // Vertical grid line 2 M5.Display.drawLine(197, 39, 197, 238, DARKGREEN); // Vertical grid line 3 M5.Display.drawLine(257, 39, 257, 238, DARKGREEN); // Vertical grid line 4 M5.Display.fillRect(0, 0, 319, 38, BLACK); M5.Display.setTextColor(MAGENTA); M5.Display.drawString(String(temp,1),17,0,6);M5.Display.drawString("C",115,17,4); // Display temperature M5.Display.setTextColor(CYAN); M5.Display.drawString(String(humi,0),155,0,6);M5.Display.drawString("%",215,17,4);// Display humidity uint16_t clrNo; // Variable to set background color for "WBGT" display based on its value M5.Lcd.setTextColor(WHITE,BLACK); // Set text and background colors for WBGT value switch(WBGT_No(temp, humi)){ // Select background color according to WBGT level case 0: clrNo = BLUE; M5.Lcd.drawString("< 25",275,20,2); break; // Blue case 1: clrNo = YELLOW; M5.Lcd.drawString("25-27",270,20,2); break; // Yellow case 2: clrNo = ORANGE; M5.Lcd.drawString("28-30",270,20,2); break; // Orange case 3: clrNo = RED; M5.Lcd.drawString("30 <",275,20,2); break; // Red } M5.Lcd.fillRect(255, 0, 64, 20, clrNo); // Fill the WBGT background M5.Lcd.setTextColor(DARKGREY,clrNo); // Set text and background colors for the WBGT label M5.Lcd.drawString("WBGT",272,2,2); // Display the "WBGT" label M5.Lcd.drawRect(255, 0, 64, 36, clrNo); // Draw the WBGT frame } } } } mode = 0; // Transition to advertising scan mode after displaying the graph while(millis() < tm){} // Wait for 1 minute tm = 0; break; } } ーーーーーーーーーーーーーーーーーーーーーーーーーーーーーーーーーーーーー
The sketch shown in Listing 1 consists of the functions listed in Table 2.
Table 2. Functions Used in the Sketch
| Line Numbers | Function | Description |
|---|---|---|
| 13–49 |
uint8_t WBGT_No() |
This function provides a simplified estimate of the WBGT (Heat Stress Index) based on temperature and humidity inputs. The estimated WBGT is classified into one of four levels: WBGT below 25 → 0 WBGT 25 to below 28 → 1 WBGT 28 to below 31 → 2 WBGT 31 or higher → 3 |
| 52–58 |
void onResult() |
This function is called each time a device is detected during an advertising scan. Each time it is executed, the adv_cnt counter is incremented. If the counter exceeds 100, the advertising scan is stopped. |
| 60–77 | void setup() | This function runs only once when the sketch starts. It initializes the M5Stack color LCD and Bluetooth communication settings. |
| 79–241 | void loop() | This function runs continuously while the M5Stack is operating. Tasks such as graph plotting are performed within this function. |
The following sections explain each function in more detail.
4-3. WBGT_No()
This function estimates a WBGT value from temperature and humidity measurements, as described in Section 2-2, "About WBGT."
The estimation is based on the Indoor WBGT Simple Estimation Chart Ver.4 published by the Japanese Society of Biometeorology. The chart has been converted into data that can be easily processed by the sketch, allowing the corresponding WBGT value to be determined from temperature and humidity measurements.
Listing 1, lines 14–31 contain the data derived from the estimation chart. Because the original chart does not specify the WBGT = 31 threshold for relative humidity values of 20% and 25%, the corresponding values have been estimated and added to the data used in this sketch.
4-4. onResult()
The onResult() function is executed each time data is received during a BLE advertising scan.
During testing, the M5Stack occasionally restarted when a large number of nearby devices were transmitting advertising packets. To prevent this, the sketch stops the advertising scan after receiving data from more than 100 devices.
4-5. setup()
When the sketch starts, the setup() function beginning at Listing 1, line 60 is executed first.
The setup() function performs the initial configuration required for Bluetooth communication, the color LCD, and other M5Stack functions.
Listing 1, line 63 (Serial.begin(115200)) initializes serial communication at 115200 bps. Serial communication is used to check the operation of the sketch. In the Arduino IDE, select Tools > Serial Monitor to open the Serial Monitor and view the execution status.
For example,
Serial.println("Scanning...");
displays "Scanning..." in the Serial Monitor. Adding statements like this at various points in the sketch makes it possible to check its execution status while it is running.
Listing 1, lines 66–67 initialize sprites for drawing the graph. In this sketch, the graph plot, which scrolls and changes every minute, and the static graph frame and grid lines are prepared separately and then combined for display.
Listing 1, line 69 contains M5Stack LCD commands that initialize the LCD and display "Scanning...".
Listing 1, lines 73–76 configure Bluetooth operation. These settings configure passive scanning of BLE advertising packets and specify that the onResult() function in lines 51–58 is executed each time a device is detected during the advertising scan.
4-6. loop()
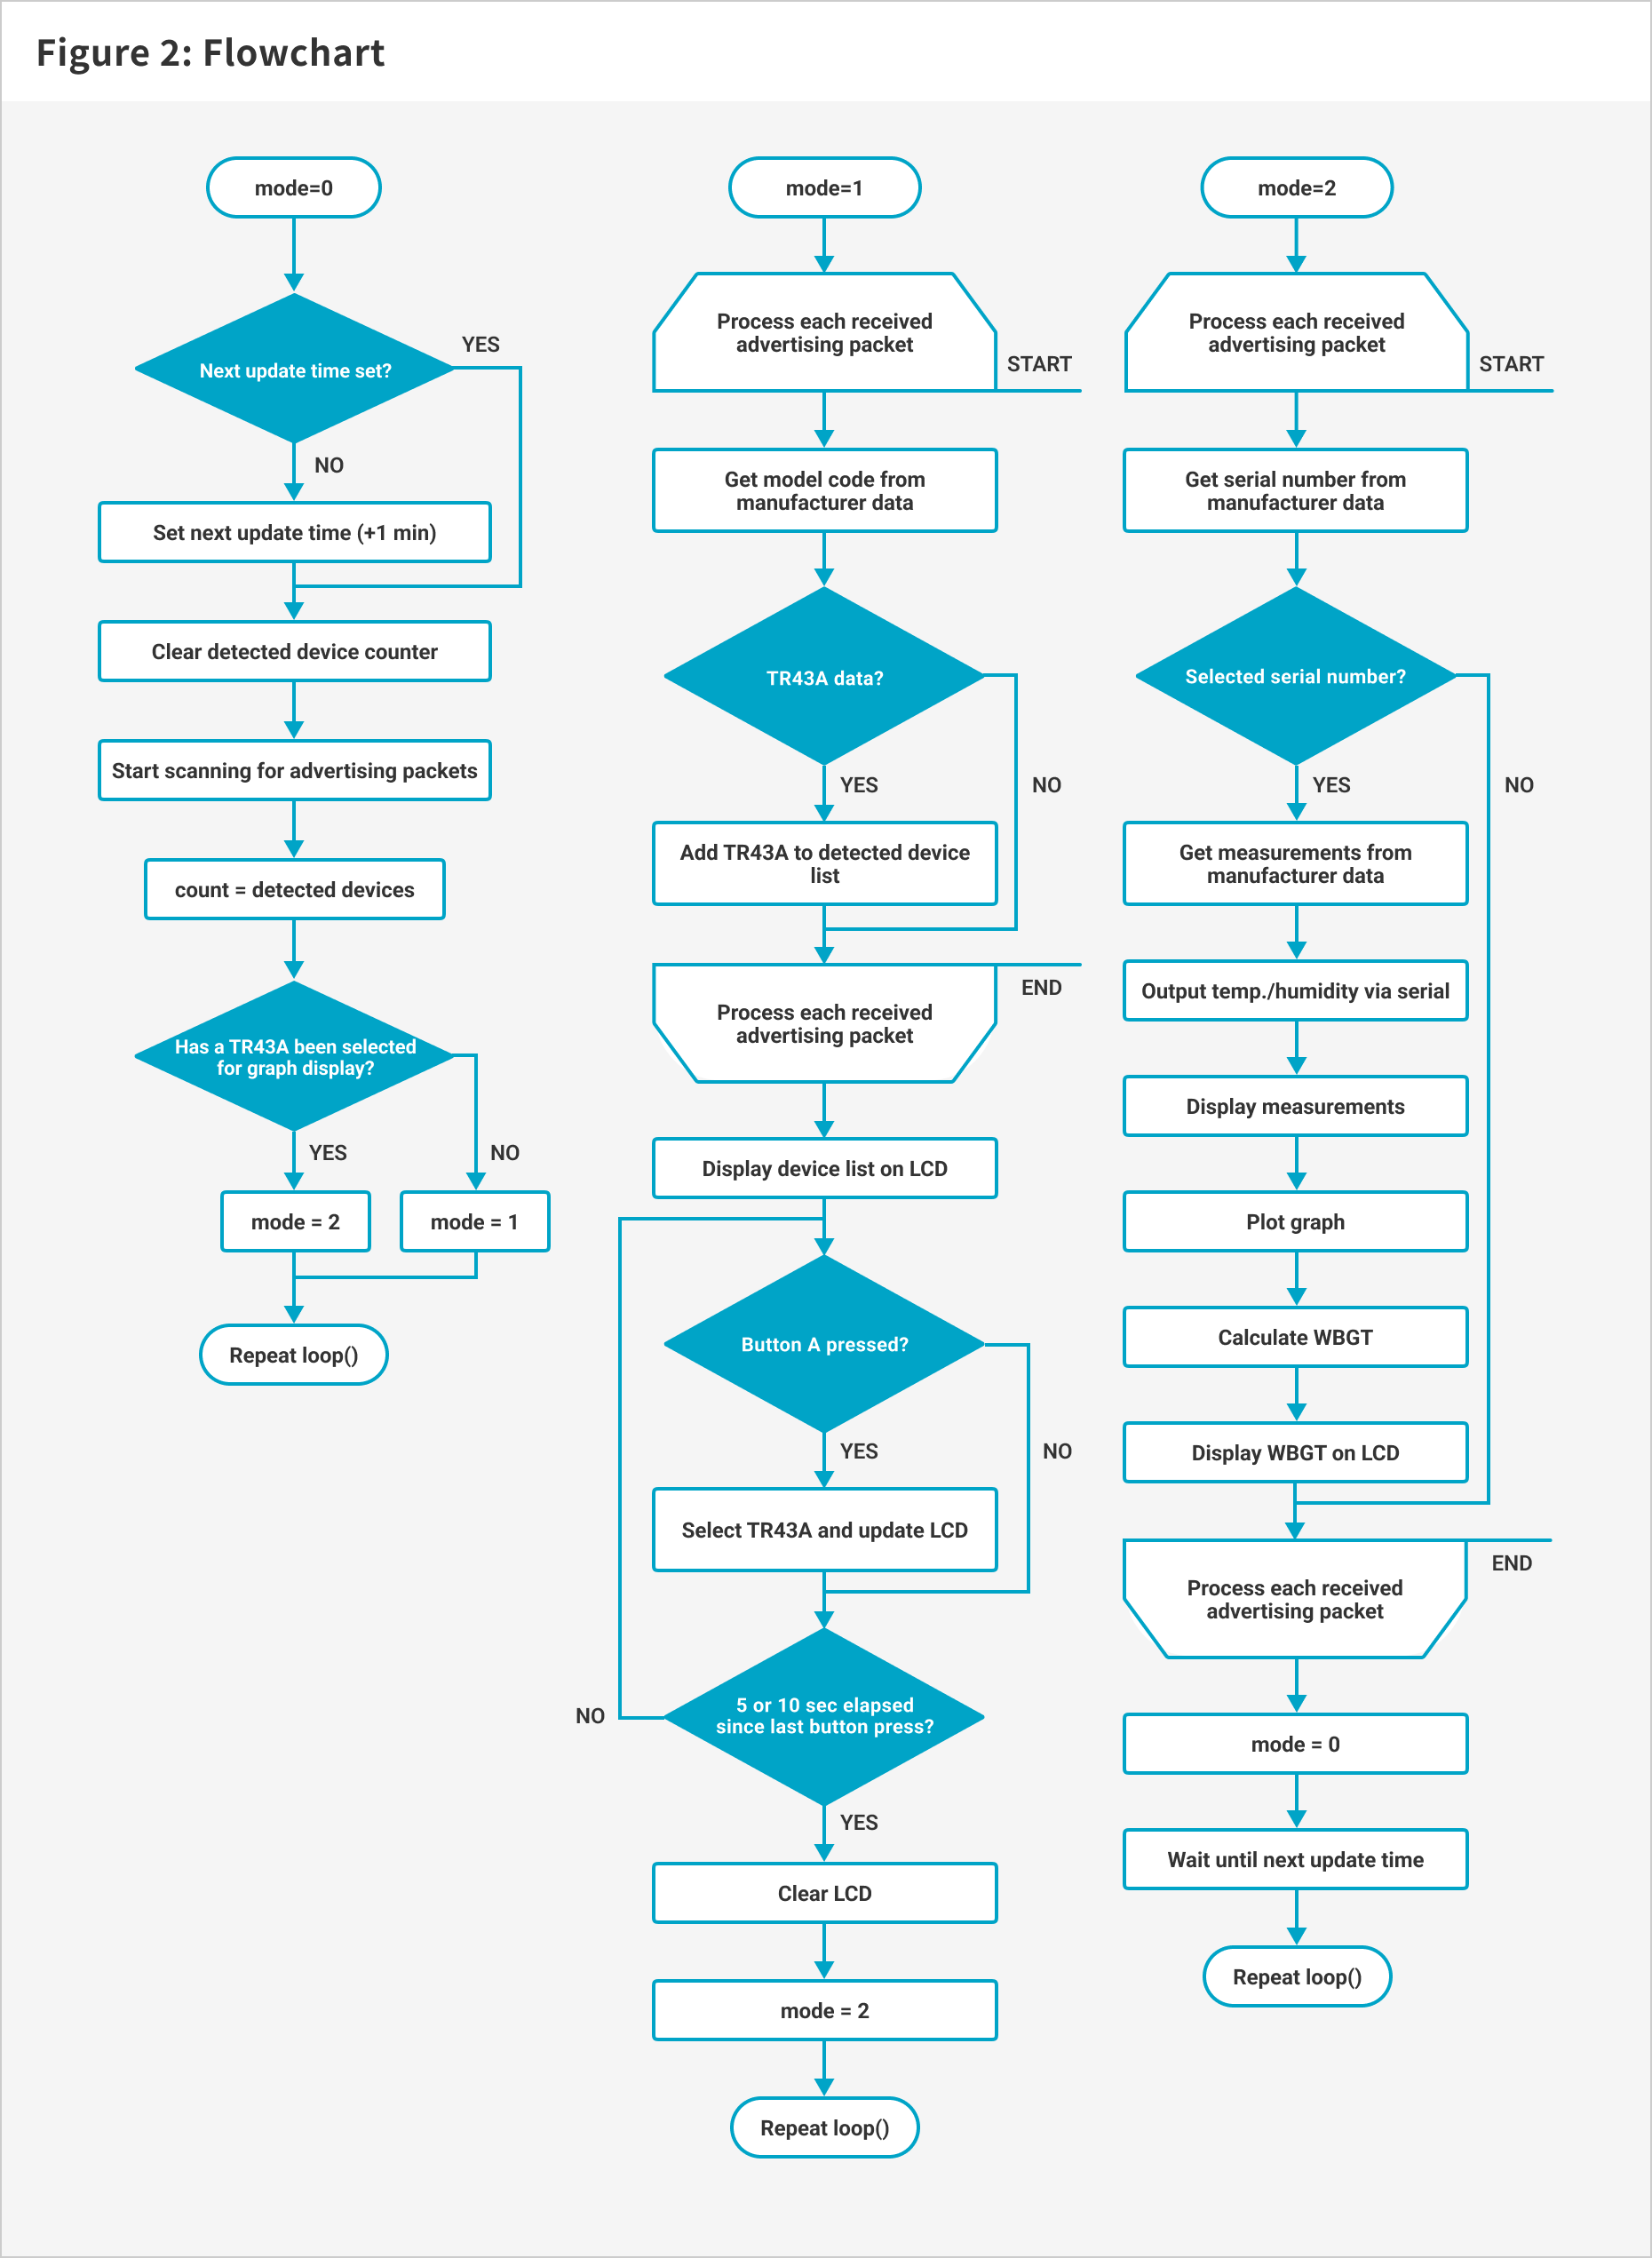
The loop() function uses a variable called mode to switch between different processing routines.
An overview of the processing performed for each mode value is shown in Table 3.
Table 3. Overview of Processing by Mode
| Mode Value | Description |
|---|---|
| 0 | Performs a BLE advertising scan for approximately 10 seconds. After the scan completes, the sketch transitions to either Mode 1 or Mode 2. If no target TR43A has been selected for graph display, it transitions to Mode 1. If a target TR43A has already been selected, it transitions to Mode 2. |
| 1 | Displays a list of TR43A devices detected during the advertising scan. Each time the left button on the M5Stack is pressed, the selected device changes. This allows the user to choose the TR43A to be displayed on the graph. If no button is pressed for 5 or 10 seconds, the sketch exits Mode 1 and transitions to Mode 2. |
| 2 | Uses measurement data received from the selected TR43A to display a graph and an estimated WBGT (Heat Stress Index) value. |
The flowcharts for each mode are shown in Figure 2.
4-6-1. Mode 0
When the loop() function starts, it first executes Mode 0.
Listing 1, line 90 sets a one-minute timer (tm). This one-minute interval is used for the advertising scan and graph display update cycle.
Listing 1, line 92 (pBLEScan->start(scanTime)) starts a passive scan for BLE advertising packets. The variable scanTime specifies the scan duration in seconds and is set to 10 seconds in this example.
When the advertising scan finishes, the number of detected devices is stored in the variable count.
The sketch then switches to Mode 1 or Mode 2, depending on the next process. If no target device has been selected for graph display, it switches to Mode 1. If a target device has already been selected, it switches to Mode 2.
4-6-2. Mode 1
Mode 1 is executed when no target device has been selected after the BLE advertising scan performed in Mode 0.
A list of the serial numbers of detected TR43A devices is displayed on the LCD. Each time Button A (the left button on the M5Stack) is pressed, the cursor moves to the next serial number, allowing the user to select the device to be used for graph display.
If you want to select the TR43A where the cursor is initially positioned, no action is required.
If no button is pressed for approximately 5 to 10 seconds, the sketch automatically switches to Mode 2 and begins displaying the graph.
The Manufacturer Data obtained from the TR43A advertising packets is shown in Table 4.
4-6-3. Mode 2
Mode 2 is executed when a target device has already been selected after the BLE advertising scan performed in Mode 0.
The sketch searches the scan results for the serial number of the selected device and obtains its temperature and humidity measurements.
Listing 1, lines 163–166 extract the temperature and humidity values from the Manufacturer Data and store them in the variables temp and humi, respectively.
Listing 1, line 168 outputs the temp and humi values through the serial communication configured in line 63, allowing the values to be checked in the Serial Monitor.
Listing 1, lines 170–189 calculate the coordinates for plotting the temp and humi values and draw the graph.
Listing 1, lines 192–211 draw the graph frame, grid lines, and scale values on the vertical axis.
Listing 1, lines 213–217 display the temp and humi values on the M5Stack LCD.
Listing 1, lines 219–230 calculate and display the estimated WBGT value from the temp and humi values. Listing 1, line 222 uses the WBGT_No() function described in Section 4-3 to calculate the estimated WBGT.
Listing 1, line 237 adjusts the timing so that the sequence of scanning for advertising packets, obtaining measurements from the TR43A, and updating the graph display is performed at one-minute intervals.
After a target device has been selected, the following process repeats once per minute:
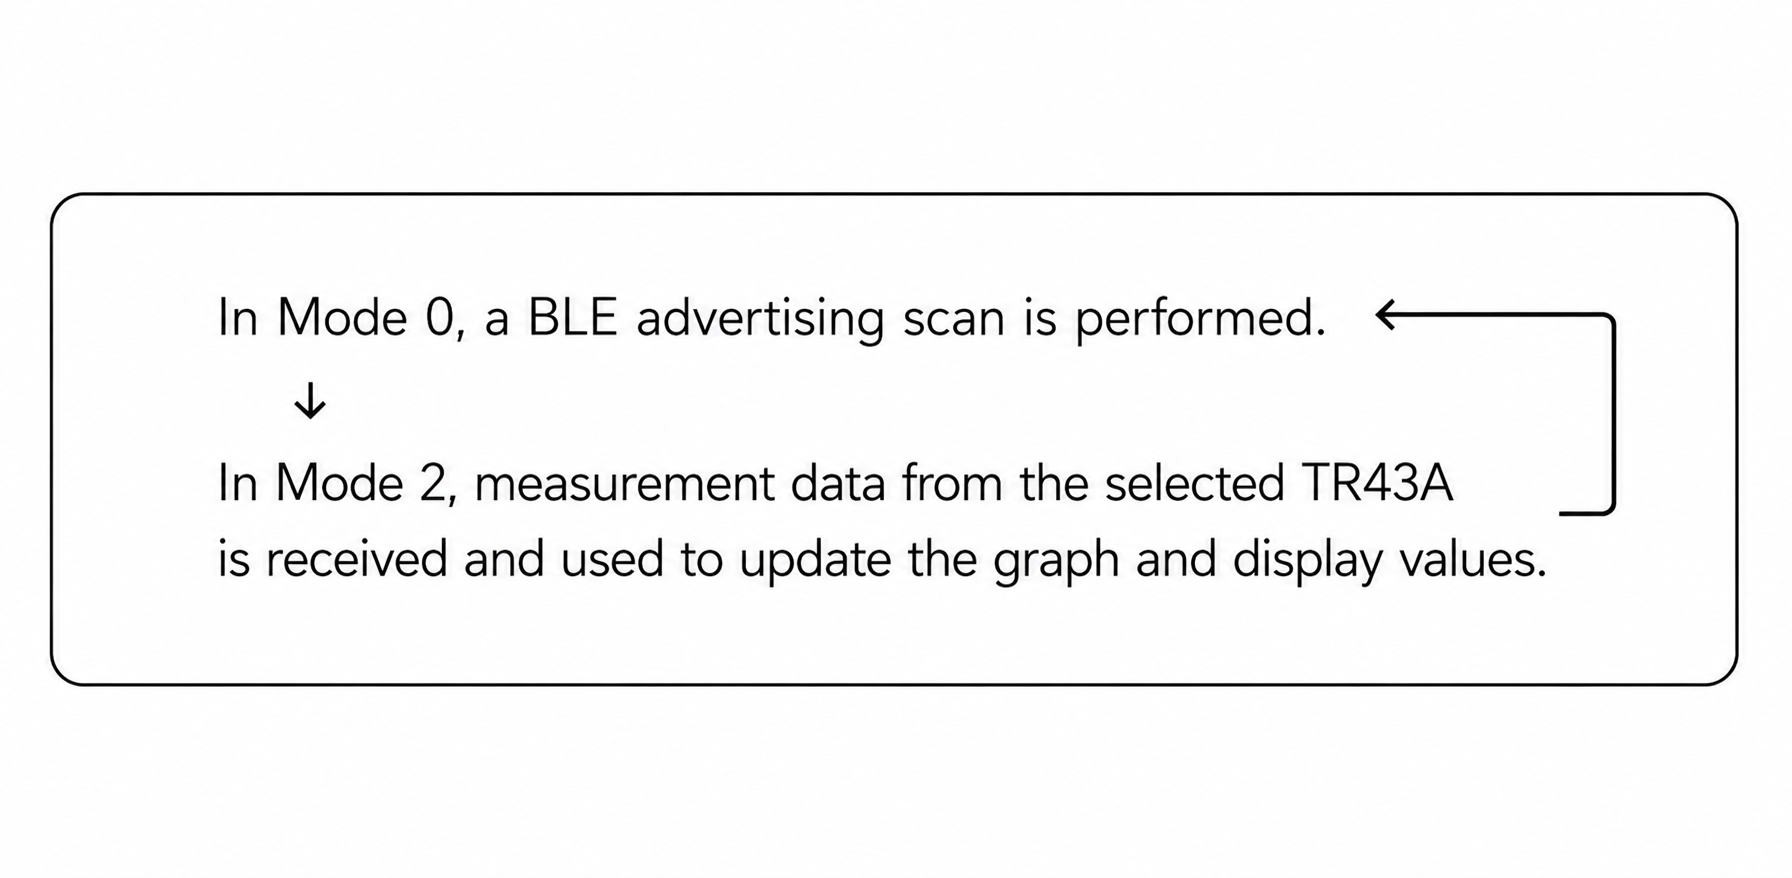
Table 4. Manufacturer Data Structure
| Byte Position | Data Type | Description | Remarks |
|---|---|---|---|
| 0–1 | Uint16 | Company ID | 0x0392 → T&D |
| 2–5 | Uint32 | Device Serial Number |
TR43A: 0xXX44XXXX or 0xXX45XXXX TR32B: 0xXX46XXXX or 0xXX47XXXX |
| 6 | Byte | Control Code | |
| 7 | Byte | Counter Values | |
| 8 | Byte | Status Code 1 | |
| 9 | Byte | Status Code 2 | |
| 10–11 | Uint16 | Measurement 1 | Temperature |
| 12–13 | Uint16 | Measurement 2 | Humidity |
| 14–15 | Uint16 | Measurement 3 | |
| 16–17 | Uint16 | Measurement 4 | |
| 18–19 | Uint16 | Reserved for Inspection |
5. Uploading and Running the Sketch
5-1. Compile and Upload
Connect the M5Stack to the computer using a USB cable.
Select Sketch > Upload in Arduino IDE or click the Upload button.
The IDE compiles the sketch and uploads it to the device. Status messages indicating that the sketch is being compiled and uploaded are displayed during the process.
Once uploading is complete, the M5Stack automatically begins executing the sketch.
However, if an error occurs during the upload process, the sketch may not reach the "Done uploading." message.
In that case, check the possible causes and solutions listed in Table 5.
Table 5. Arduino IDE Error Examples
| Arduino IDE Output | Possible Cause / Solution |
|---|---|
| exit status 1... |
There is an error in the sketch. Review the messages displayed below "exit status 1" and check any lines highlighted in the editor. Also verify that Tools > Board > M5Core is selected. If the M5Core board is not available, install the M5Stack by M5Stack official board package by following the instructions in the M5Stack documentation. https://docs.m5stack.com/en/start |
| Failed uploading: no upload port provided |
Verify that the M5Stack is connected to the PC with a USB cable. Also check that the correct port is selected under Tools > Port. |
| Failed uploading: uploading error: exit status 1 |
Uploading the sketch to the M5Stack failed. Try reducing the upload speed by selecting Tools > Upload Speed > 115200 and upload the sketch again. |
5-2. Operation Check
When the sketch starts, “Scanning...” appears on the LCD.
When nearby TR43A devices are detected, their serial numbers are displayed.
If multiple devices are found, press Button A (the left button) on the M5Stack to select the desired device for graph display.
After approximately 5 to 10 seconds, the display automatically switches to graph mode.
Measurement values contained in advertising packets are updated once per minute, so the graph is also updated once per minute.
To view debugging information, keep the M5Stack connected to the computer, select Tools > Serial Monitor, and set the baud rate to 115200.
The Serial Monitor displays status messages generated by the Serial.print... statements in the sketch.
The Serial Monitor displays status messages generated by the sketch.
Power Considerations
When powered only by the built-in battery, the M5Stack may operate for approximately one hour depending on usage conditions.
For continuous operation, an external USB power source is recommended.
6. Conclusion
This project demonstrates how measurement data received from a TR43A can be processed and visualized using an M5Stack microcontroller.
In addition to displaying temperature and humidity readings, the system provides trend graphs and an estimated WBGT value, making environmental conditions easier to understand at a glance.
We hope this example encourages users to explore additional ways of integrating T&D data loggers with microcontroller platforms.
Disclaimer
The sketch introduced in this article is provided as a reference example. Operation is not guaranteed in all environments or under all conditions.
T&D Corporation assumes no responsibility for any loss, damage, or other consequences resulting from the use of the information provided in this article or from executing the sketch.