Graph and Report Generation
Graph View and Operations
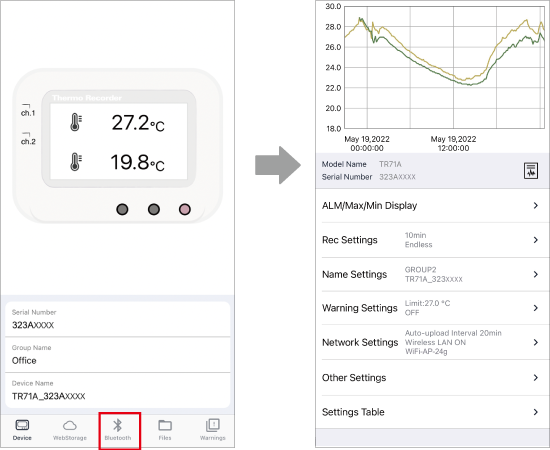
Recorded data is collected and displayed in a graph using the communication method selected on the Device Info Screen (WebStorage or Bluetooth) or WLAN Direct Communication.
- Data collection and graphing can be done for one device at a time.
- The number of data to be collected via Bluetooth or WLAN direct communication can be selected from the ([
 Settings] Button) on the graph screen.
 - For the procedure to collect data via wireless LAN direct communication, refer to [Usage by Communication Method] - [Device Configuration and Data Collection via WLAN Direct Communication (wb/wf)] in this help.
- The data sent to the cloud from the File List cannot be retrieved here.
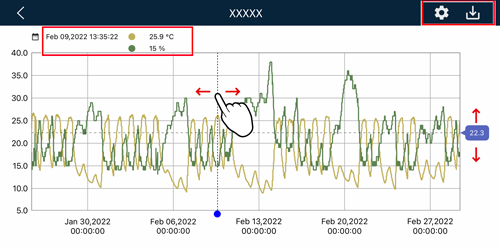
By rotating your mobile device to landscape mode, the graph display will expand to full screen.
-
 [Download] Button
-
Tap this to download the data to your smartphone or tablet.
- Downloaded files can be viewed on the mobile device and exported by a variety of means. For details refer to [Reading the Display] - [File List Screen].
-
 [Settings] Button
-
Tap this to view or change the Graph Display Count setting.
You can select to display 1000, 2000, 4000, 8000, 16000 readings or All data in the graph.- Default setting is 16000 readings.
- For the storage capacity of the logger, refer to [Device Settings] - [Configuring Device Settings] - [Recording Settings] - [Logging Capacity].
- Moving Vertical Cursor
-
A long press on the graph in full screen mode will bring up a vertical cursor.
- The screen will show the date, time, and readings for the cursor position.
- Slide right and left to move the cursor.
- Moving Horizontal Cursor
-
Slide up and down to move the cursor (in landscape mode).
- Zoom in and out
-
Pinch in or out anywhere on the graph (in portrait/landscape mode).
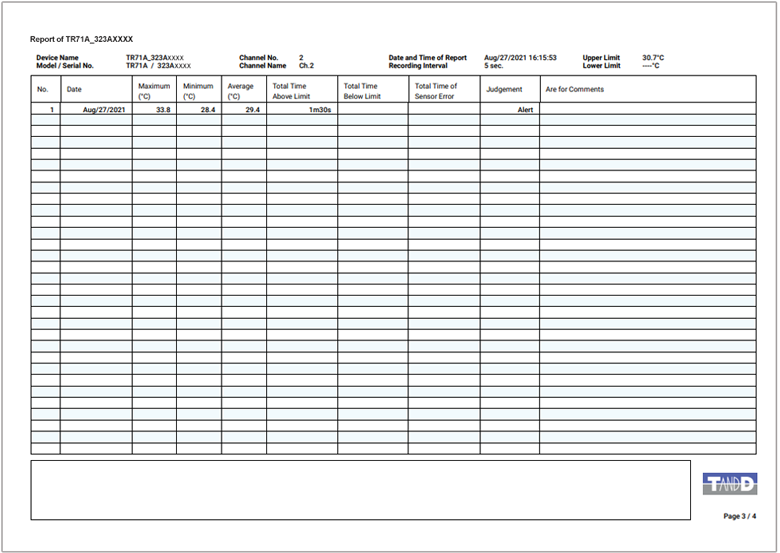
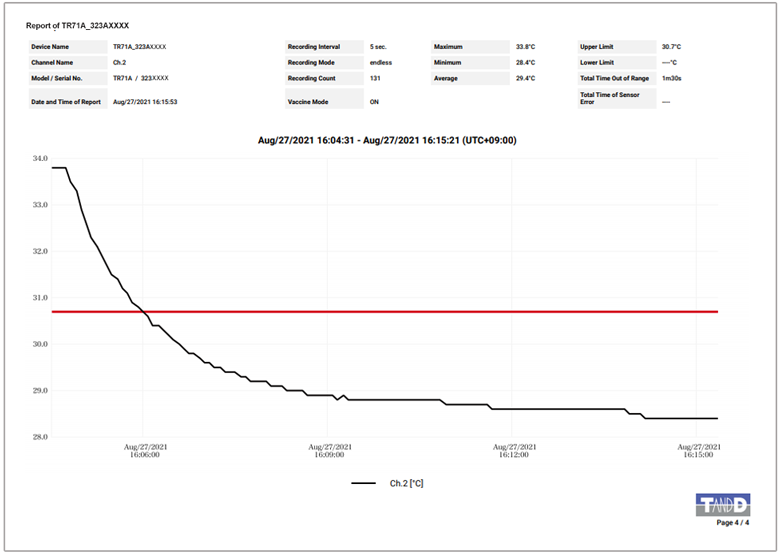
Report Creation and Output
Here you can create a data report in PDF format. The report can then be printed, saved or shared via email or apps that can handle PDF files.
Tap ![]() to open the Report Settings screen.
to open the Report Settings screen.
- Only data collected via Bluetooth or WLAN direct communication are available for report generation.
Make the necessary settings and tap [Create] to create a report.
- Title
-
Optional (up to 30 characters)
- If empty the title will be [Report for Device Name].
- Output Channel(s)
-
Select the output channel(s).
- By default, both channels are selected.
- The same title and settings will be displayed from the second time; please change if necessary.
- Report creation time and the number of pages depend on the amount of data.
- A report can also be created from the File List Screen.
- The generated PDF file cannot be sent to T&D WebStorage Service.
Report Sample
Print, Email, Share, or Save a Report
Select the output option for the generated report from the tabs on the bottom of the screen.
If you exit the app or go back to the previous screen without saving the report, data will be lost. You will need to create a report again.
-
 Print
Print
-
Tap here to print the report to any compatible printer nearby.
- iOS: AirPrint enabled printers
- Android: Wi-Fi enabled printers (The printer plug-in needs to be installed on your smartphone or tablet.)
-
 Email
Email
-
Tap here to send the report as an attachment via email.
-
 Share/Save
-
Tap here to open the Share/Save menu for your OS. (Icons may vary depending on the OS.)
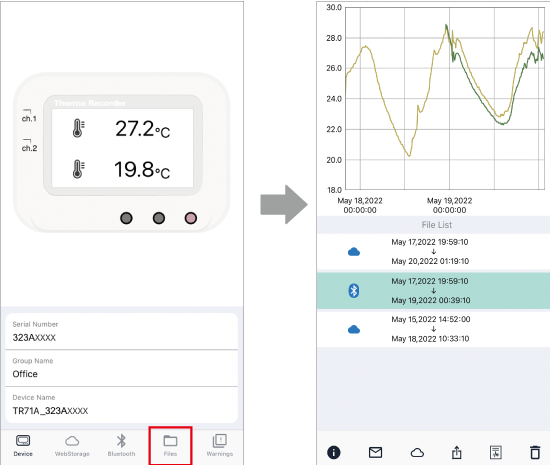
Uploading to T&D WebStorage Service
Data files downloaded via Bluetooth or direct WLAN communication can be uploaded to T&D WebStorage Service.
-
By tapping on [Files] at the bottom of the Device Info Screen, a list will appear of the data files saved to your mobile device.
-
Select a file and tap the
 icon.
icon.Make sure your WebStorage account is added to the app. (For how to add your cloud account, refer to [Editing List] - [WebStorage Accounts].
The uploaded files can be accessed from the [![]() Download] menu of T&D WebStorage Service for graph view and download (in trz format).
Download] menu of T&D WebStorage Service for graph view and download (in trz format).
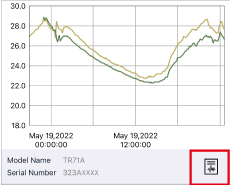
- The mark (
 ) in the file list indicates the communication method used to obtain the data.
 - The data obtained from T&D WebStorage Service cannot be uploaded.
- The file list icon menu is described in [Reading the Display] - [File List Screen] in this help.